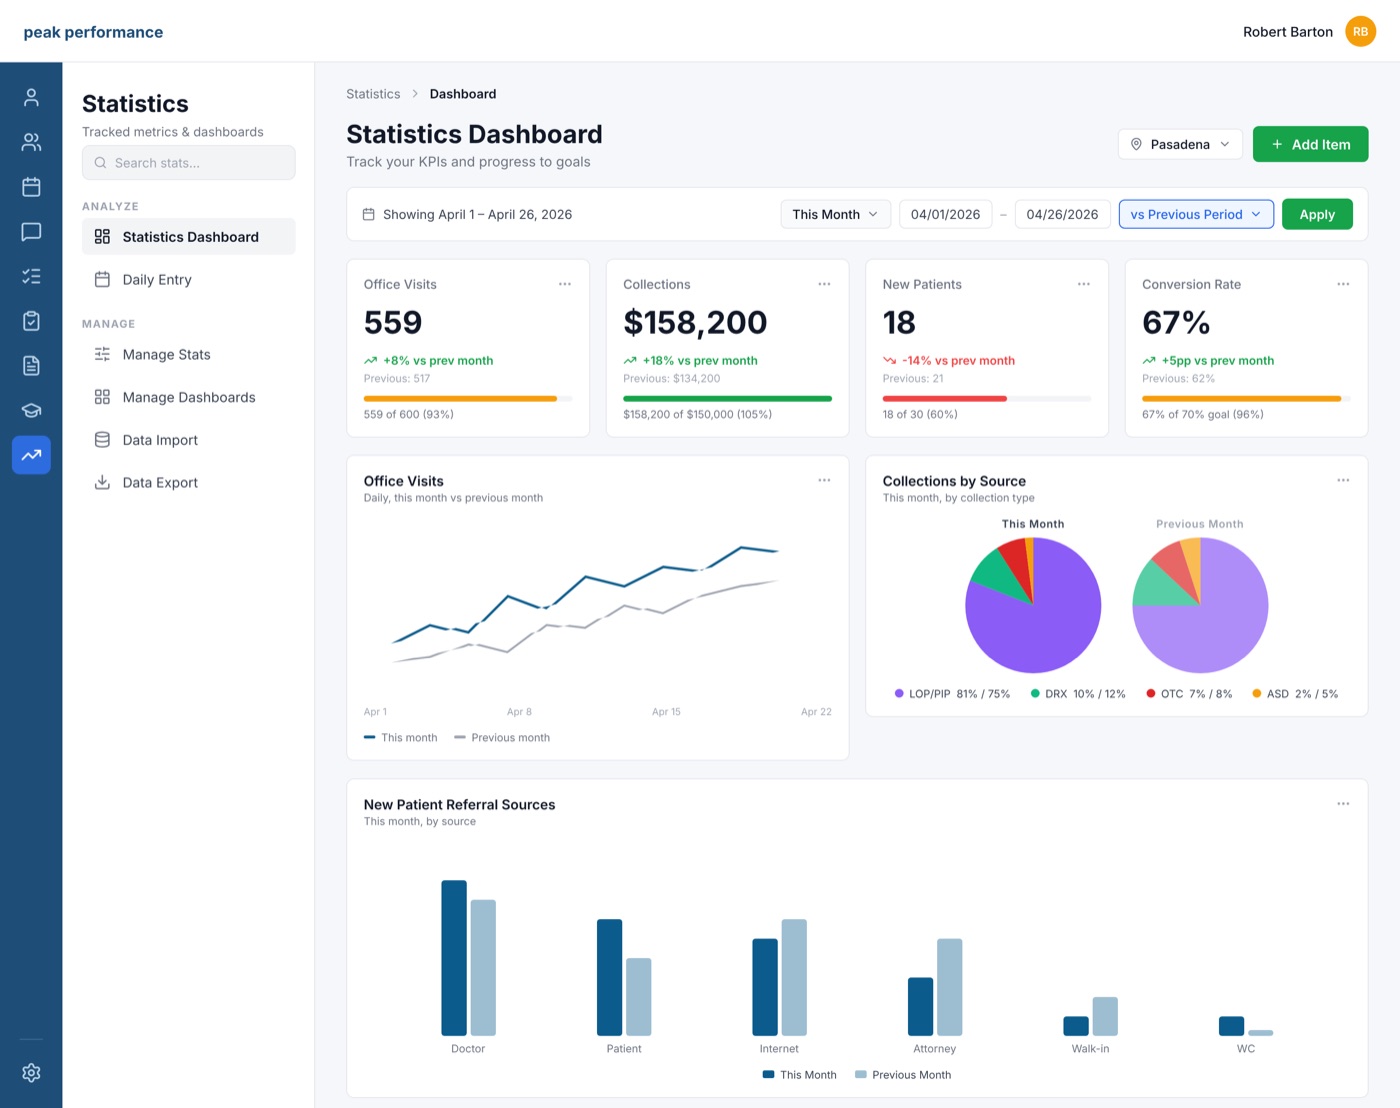
Build dashboards for the stats you choose, set goals with thresholds, and watch trends by location, person, and time.

Statistics is where the results get measured — proof the standard is working.
From gut feel and whatever the practice-management report happens to show. By the time a slow month is visible, it's over.
The numbers you actually manage by — the ones you'd check daily if it were easy — live in your head or nowhere.
Define your own stat library — production, collections, new patients, whatever you manage by — entered per location per day, or computed by formula.
Set targets with warning and critical thresholds, and see status at a glance as numbers, charts, or gauges.
Filter by date range and location, mark closure days so they don't poison averages, and spot the trend before it becomes the quarter.
Personal and team dashboards, plus expiring share links for a partner, bookkeeper, or consultant.
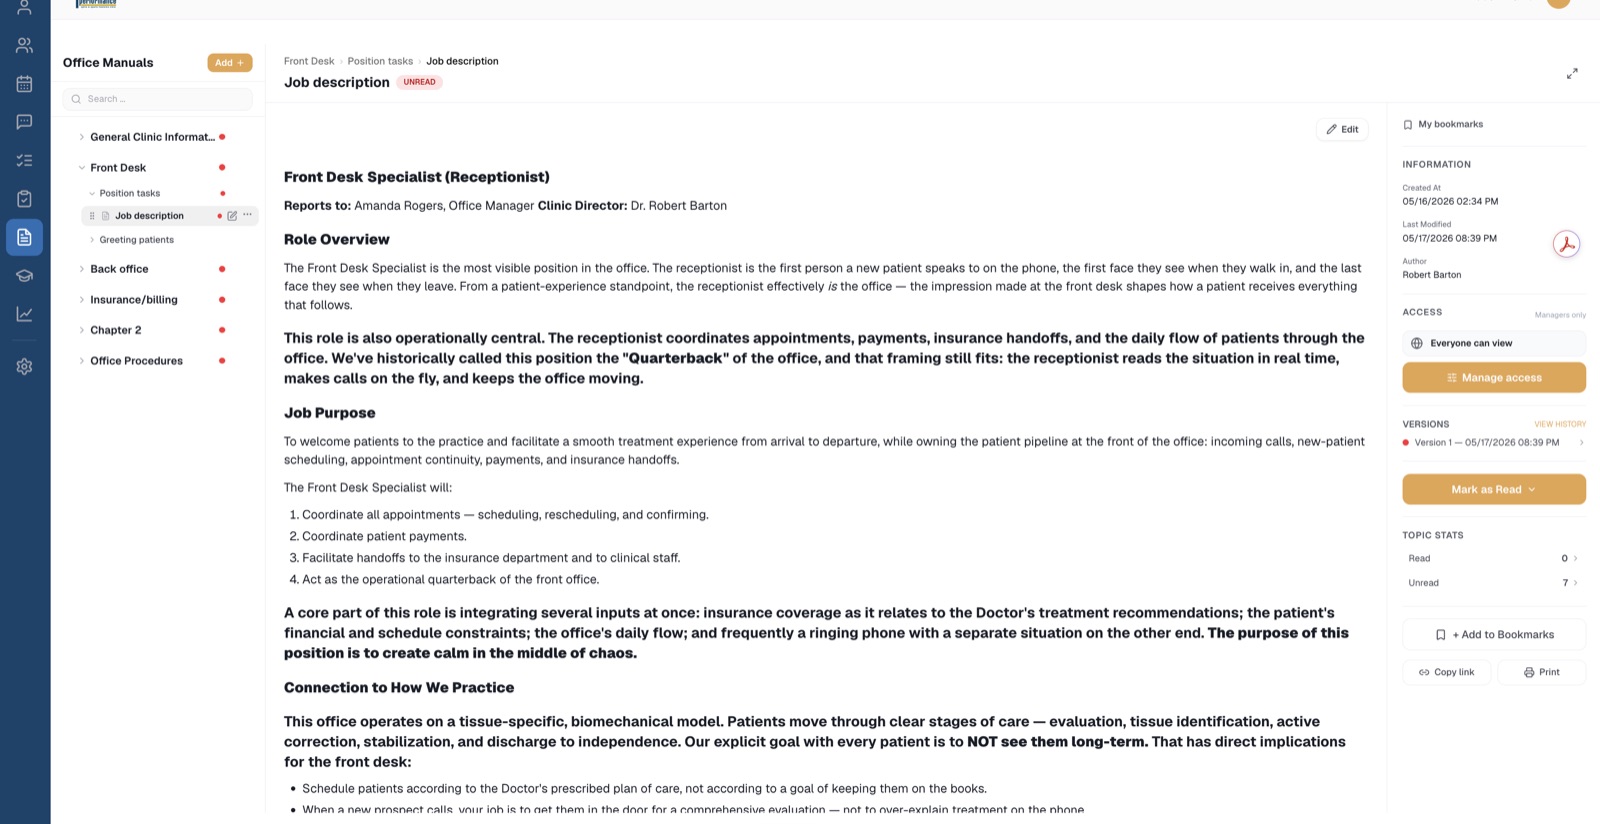
A falling stat usually traces back to a standard that drifted. Update the manual, retrain, re-verify — the loop starts where it began.
Next: Office Manual →
Testimonial slot — a practice owner on catching a problem mid-month instead of at the end of the quarter.
Book a demo and we'll show you the statistics dashboards working on a real practice setup — and tell you honestly whether it fits how you want to run your office.